KEY TAKEAWAY | Florida's improving crime signal coincided with much stronger interstate migration and faster home-value growth around 2022. Colorado's worsening signal coincided with muted inflows and slower price growth. Yet Colorado still grew, its home values did not collapse, and the later housing comparison reversed. Safety matters, but it does not sort households frictionlessly. |
Crime statistics are local quality ratings
When households compare places, safety is not a side issue. It shapes daily routines, children's independence, use of parks and transit, insurance costs, and the perceived durability of an investment in a home. Because public safety is produced partly through policing, courts, street design, lighting, prevention, and social cooperation, it is a core local public good.
That makes crime data more than a description of past incidents. In a marketplace of places, a crime rate or composite score can operate like a quality rating. It can change who considers a community, how much buyers will pay, and whether existing residents begin looking elsewhere.
Charles Tiebout's classic 1956 model gives this intuition a formal structure. Households reveal preferences by choosing among jurisdictions that offer different bundles of taxes and local services, an idea often summarized as voting with their feet. The model's clean result depends on demanding assumptions, including full knowledge, many communities, no employment restrictions, and full mobility. Tiebout also acknowledged that actual households have neither perfect knowledge nor perfect mobility. [1]
Applied to public safety, the prediction is straightforward. A worsening crime signal should reduce marginal demand for a place, which should show up in weaker in-migration, softer population growth, or slower home-value appreciation. An improving signal should work in the opposite direction, all else equal. The important phrase is all else equal. In local housing markets, it almost never is.
THE PURE TIEBOUT PREDICTION
1 | 2 | 3 |
A natural contrast: Colorado and Florida
The 2022 StatisNostics data create a sharp two-state contrast. Colorado's Crime Score rose from 83 in 2021 to 89 in 2022. Because lower scores are safer, the six-point increase was a deterioration. Florida's score moved the other way, falling from 51 to 25, a 26-point improvement. [2, 3, 4]
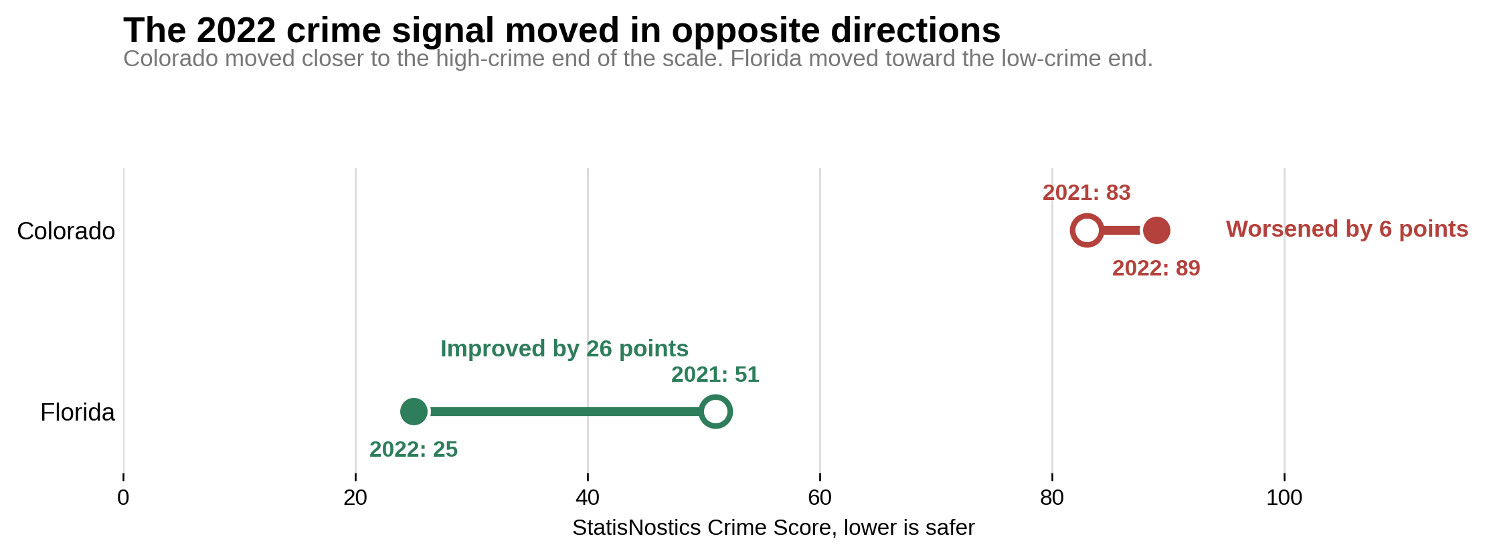
Figure 1. Crime Score change from 2021 to 2022.
Source: StatisNostics Colorado and Florida crime statistics [3, 4]. Lower scores are safer.
The underlying rates reinforce the contrast. In 2022, Colorado recorded 492.5 violent crimes per 100,000 residents, well above the national rate of 380.3. Its property-crime rate was 3,147.6 per 100,000, compared with 1,952.8 nationally. Florida was below the national rate in both categories, at 258.9 for violent crime and 1,566.2 for property crime. [3, 4]
Still, one score cannot summarize every safety concern. Florida's violent-crime rate fell sharply in the StatisNostics series, but its property-crime rate rose 5.2 percent and reported motor-vehicle thefts increased 42.0 percent. Colorado's property-crime rate also edged up. A household worried about car theft may read the same state differently from a household focused on violent crime. The rating is useful, but it compresses a multidimensional public good into a single signal. [3, 4]
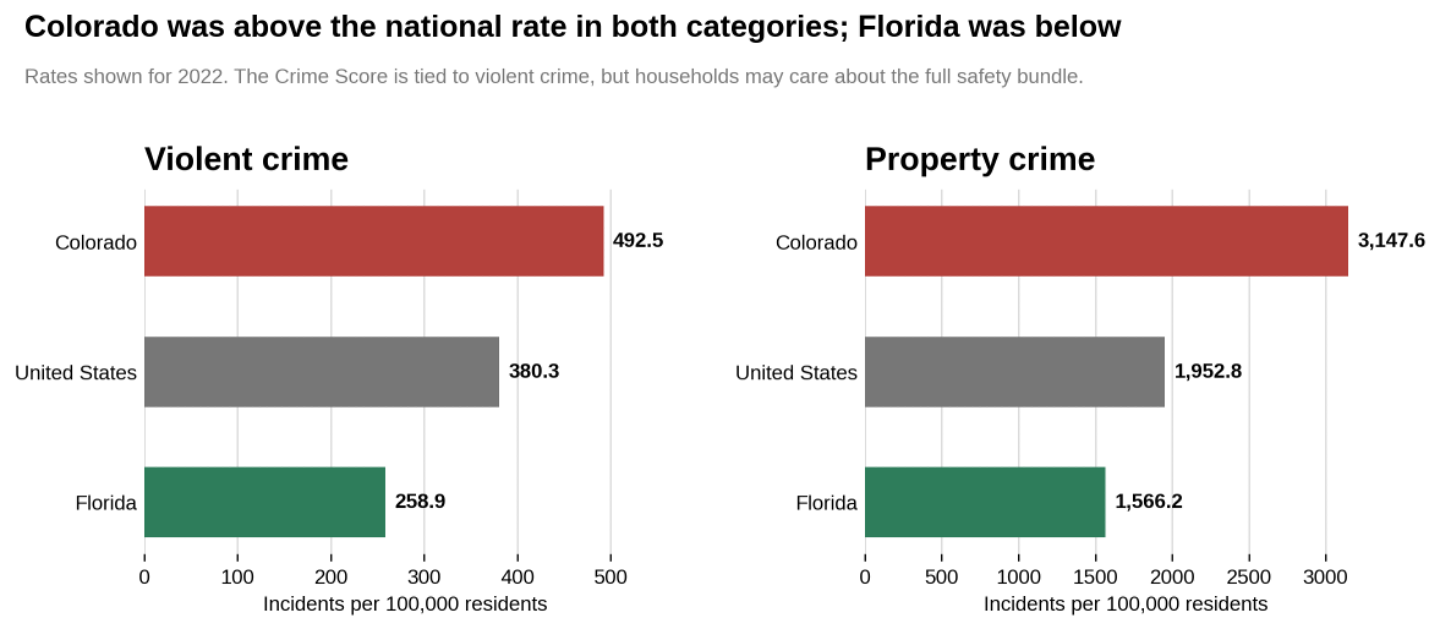
Figure 2. Violent and property crime rates in 2022.
Source: StatisNostics Colorado and Florida crime statistics [3, 4]. National rates shown on the same pages.
At a glance: the two-state scorecard
Indicator | Colorado | Florida | Tiebout reading |
Crime Score, 2021 to 2022 | 83 to 89 | 51 to 25 | Safety signal favored Florida |
Violent crime, 2022 | 492.5 | 258.9 | U.S. rate: 380.3 |
Property crime, 2022 | 3,147.6 | 1,566.2 | U.S. rate: 1,952.8 |
Domestic migration rate, 2022 | 0.9 | 14.1 | Large inflow advantage for Florida |
Population growth, 2021 to 2022 | 0.7% | 2.6% | Florida grew much faster |
ZHVI growth, Dec. 2021 to Dec. 2022 | 6.9% | 18.4% | Initial price response favored Florida |
ZHVI growth, Dec. 2023 to Dec. 2024 | 1.0% | -1.0% | Later housing response reversed |
Crime and crime-rate figures are incidents per 100,000 residents. Domestic migration is per 1,000 residents. Zillow Home Value Index (ZHVI) Sources: [3], [4], [6], [7].
Did households vote with their feet?
Net domestic migration is the most direct state-level measure of Tiebout-style sorting because it tracks the balance of movers arriving from and leaving for other U.S. locations. The Census Bureau expresses the rate per 1,000 residents. Its annual population estimates use a July 1 reference date, so the 2022 migration period overlaps the 2022 crime year. That means the 2022 result is context, not a clean response to a year-end crime score. [6]
Even with that timing caution, the contrast is large. Florida's 2022 net domestic migration rate was 14.1 per 1,000 residents, compared with 0.9 in Colorado. The cleaner lagged check points in the same direction. In 2023, Florida gained 8.1 domestic migrants per 1,000, while Colorado gained 1.0. [6]
The strong-form Tiebout prediction still fails. Colorado did not experience an interstate exodus. Its domestic migration balance remained slightly positive through 2024. Florida's advantage also faded rapidly, with its rate falling to 2.5 by 2024, versus 0.8 in Colorado. A one-time crime-score divergence did not lock the states onto permanently divergent migration paths. [6]
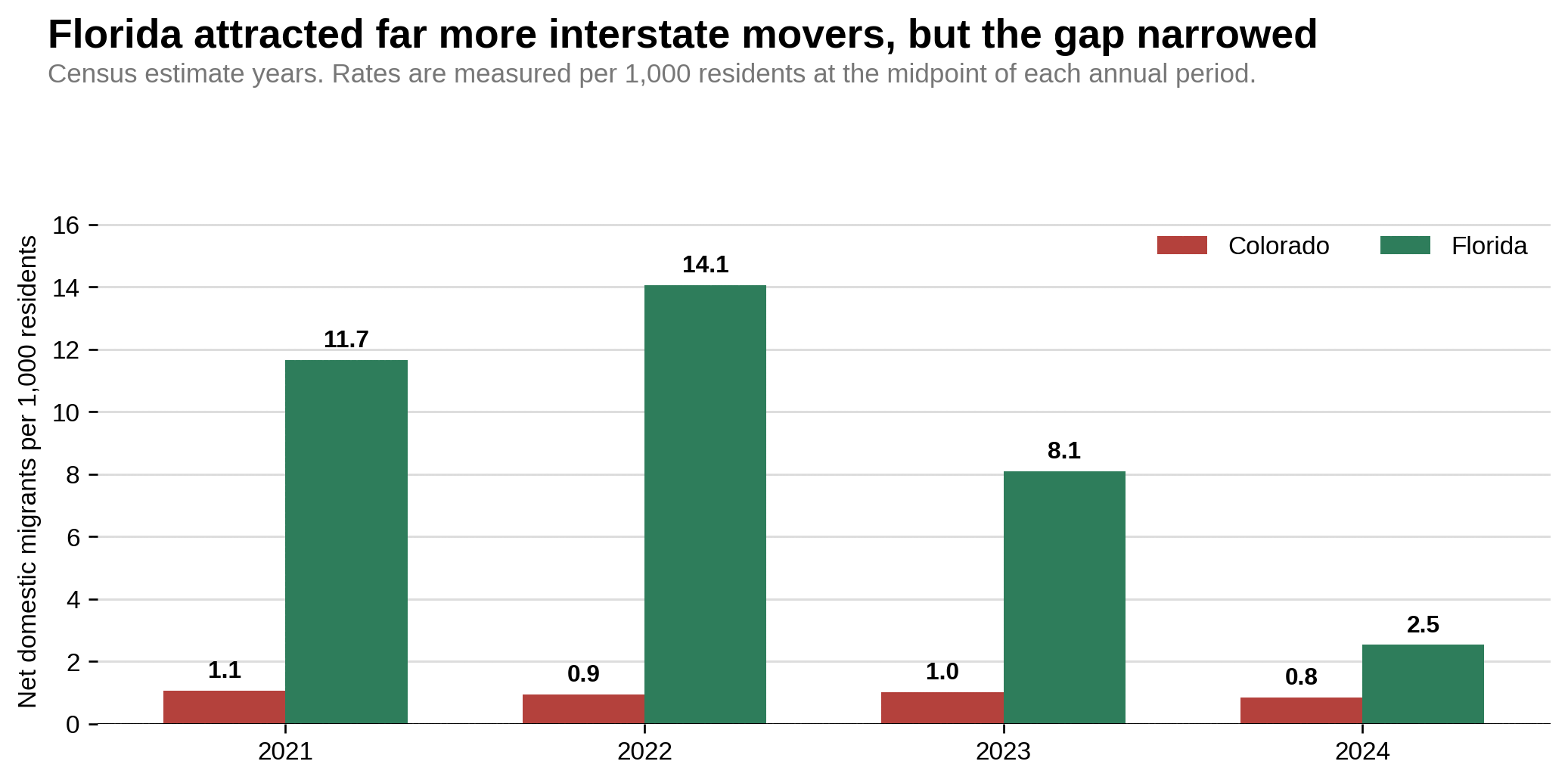
Figure 3. Net domestic migration rates, Census estimate years 2021 to 2024.
Source: U.S. Census Bureau, Vintage 2025 state population estimates [6]. Rates are per 1,000 residents.
Total population tells an even more mixed story. Colorado grew 0.7 percent from 2021 to 2022 and then 1.0 percent from 2022 to 2023. Florida grew faster, at 2.6 percent and 2.3 percent, but Colorado's growth accelerated rather than softened after its crime score worsened. Births, deaths, international migration, and within-state location choices can all separate total population growth from interstate sorting. [6]
State aggregation is another limitation. A resident who leaves Denver for a safer Colorado suburb has made a Tiebout-style choice, but the move is invisible in Colorado's state total. The local public good is often municipal or neighborhood safety, while the available comparison here is statewide. The scale of the model and the scale of the data do not perfectly match.
Did housing markets capitalize the safety signal?
The initial home-value comparison looks much like the migration comparison. From December 2021 to December 2022, Zillow's Home Value Index (ZHVI) rose 18.4 percent in Florida and 6.9 percent in Colorado. In the first lagged year, December 2022 to December 2023, Florida added another 2.0 percent while Colorado slipped 0.3 percent. [7]
That is directionally consistent with sorting. Buyers appeared more willing to bid up the state with the improving crime signal. But the later comparison again resists a single-cause story. From December 2023 to December 2024, Colorado's index rose 1.0 percent while Florida's fell 1.0 percent. The earlier gap in price growth narrowed and then reversed even though the 2022 crime-score contrast had not changed. [7]
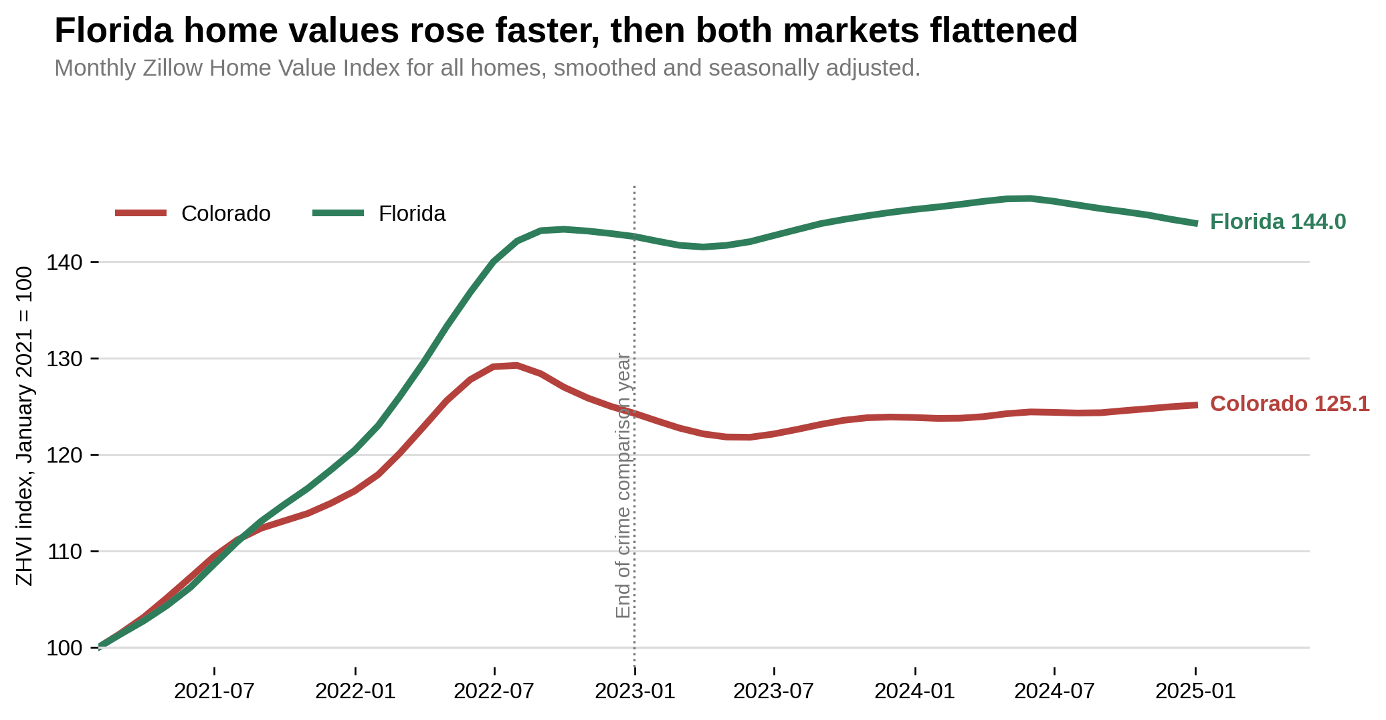
Figure 4. State home-value paths, January 2021 to December 2024.
Source: Zillow Research, Zillow Home Value Index [7]. January 2021 is indexed to 100.
Prices are an equilibrium outcome, not a direct vote count. Housing supply can absorb new demand through construction rather than higher prices. Tight supply can keep prices elevated even when some households want to leave. Financing conditions, insurance, taxes, expected future growth, and the mix of homes sold can all shape the market response. Safety can be capitalized into prices without being the dominant force in any one year.
Housing costs also create the friction the model assumes away. A household may prefer a safer jurisdiction but be unable to afford its entry price. An owner may stay because selling, buying, financing, and moving are costly. Renters face deposits, lease timing, and search costs. The choice is not between two identical homes with different crime scores. It is between complete, expensive bundles.
Why the Tiebout model and the data diverge
Job ties anchor households.
Tiebout's clean model assumes no employment restrictions, but real households often trade safety against wages, commute time, career networks, licensing, school calendars, and caregiving obligations. A crime score can change before a job can.
Moving is a fixed-cost decision.
Small or temporary changes in perceived safety may not be large enough to justify brokerage costs, deposits, closing costs, moving expenses, and the disruption of social networks. The response may occur only among new entrants or households already near a move.
Information is delayed and noisy.
Crime data arrive with lags, depend on reporting practices, and can be revised. The FBI's Uniform Crime Reporting program relies on voluntary agency submissions, and the 2021 to 2022 period overlapped the transition from the Summary Reporting System to NIBRS. StatisNostics also cautions that reporting changes can affect state comparisons. Florida's unusually large violent-crime decline is therefore a signal to investigate, not a laboratory treatment. [2, 4, 5]
Households buy a bundle, not a score.
Safety competes with employment, climate, schools, taxes, amenities, family proximity, insurance, and housing availability. Two households can observe the same crime trajectory and rationally make opposite location choices because they value the rest of the bundle differently.
The relevant geography may be smaller.
A state average can hide sharp differences among downtowns, suburbs, small towns, and rural counties. Tiebout sorting can operate within a metro area even when state population and state home values barely move. That is a measurement gap, not necessarily a behavioral failure.
THE VERDICT | Directionally, the comparison supports Tiebout sorting: Florida's improving safety signal lined up with stronger migration and faster initial home-value growth. Mechanically, it does not: Colorado kept growing, its housing market did not collapse, and later housing changes reversed. Causally, the result remains unresolved because timing, reporting, geography, and other local attributes move at the same time. |
The gap between the model and the data is the story
Crime scores can function as quality ratings in the marketplace of places, but they do not operate like commands. They change one term in a household's decision, sometimes an important one, while jobs, housing costs, moving costs, and imperfect information constrain the response.
The Colorado and Florida comparison provides a useful first-pass result. The signs line up with the model around 2022: the state with the improving safety signal attracted more domestic migrants and experienced faster home-value growth. Yet the absence of an exodus from Colorado, the rapid decline in Florida's migration advantage, and the later reversal in annual home-value growth show that public safety is only one part of a wider sorting process.
That mismatch should not be treated as noise around the theory. It identifies the real-world violations of perfect mobility. Tiebout sorting operates through the households able, informed, and ready to move, not through an instant reallocation of everyone. The size and persistence of the gap tell us how binding those frictions are.
A stronger next test would move below the state level and follow cities or counties over several years. The analysis should pair changes in StatisNostics Crime Scores with lagged domestic migration, listings, time on market, rents, and home values, while controlling for employment, housing supply, taxes, and schools. The most convincing evidence would come from matched places that look similar before their crime trajectories diverge.
For now, the evidence suggests a measured conclusion: safety matters in residential sorting, but perfect mobility does not exist. The distance between those two statements is where the economics of place becomes most informative.
Methodology
METHOD AND LIMITATIONS Crime: StatisNostics 2022 state pages. Lower Crime Scores indicate lower violent-crime rankings. The state pages draw on FBI UCR and NIBRS data and warn that reporting changes can affect comparisons. Migration and population: U.S. Census Bureau Vintage 2025 annual estimates. Population estimates have a July 1 reference date. Net domestic migration rates are per 1,000 residents at the midpoint of the period, and each new vintage revises the full series. Home values: Zillow Home Value Index for all homes, smoothed and seasonally adjusted. The index tracks the typical value in the 35th to 65th percentile range. Figure 4 sets January 2021 equal to 100. Interpretation: This is a descriptive two-state comparison, not a causal estimate. Timing overlaps, the states differ on many attributes, and state aggregates hide moves among cities and suburbs within a state. |
Sources
[3] StatisNostics, "Crime Overview in Colorado: 2022."
[4] StatisNostics, "Crime Overview in Florida: 2022."
All web sources accessed July 17, 2026. Calculations and charts by StatisNostics Research from the cited data files.